
N-EXPO TOKYO REPORT
Number & ratio of visitors by type
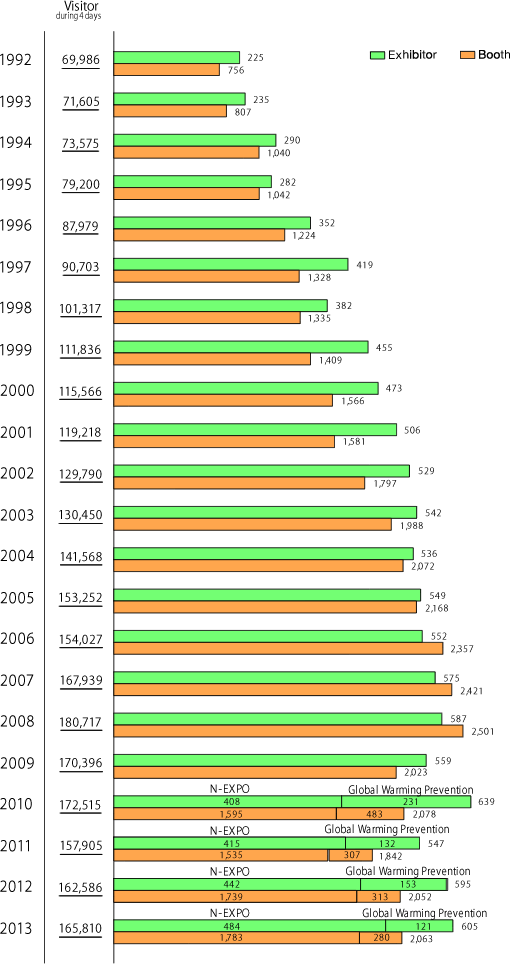
N-EXPO 2013
| Type | Number | % | Sub-total | % | |
| 1 | General & industrial waste management business | 33,983 | 20.5% | 36,914 | 22.3% |
| 2 | Environmental preservation & recycling | 2,931 | 1.8% | ||
| 3 | Environmental machine, equipment & material | 16,334 | 9.9% | 37,060 | 22.4% |
| 4 | Plant maker | 10,446 | 6.3% | ||
| 5 | Equipment sales trading company | 10,280 | 6.2% | ||
| 6 | Commodity manufacturing, sales, and distribution service | 26,400 | 15.9% | 32,368 | 19.5% |
| 7 | Transportation and warehouse | 2,818 | 1.7% | ||
| 8 | Hotel, food & beverage, and food service industry | 1,658 | 1.0% | ||
| 9 | Agriculture, forestry and fisheries | 1,492 | 0.9% | ||
| 10 | Construction | 14,259 | 8.6% | 32,026 | 19.3% |
| 11 | House and real estate | 5,803 | 3.5% | ||
| 12 | Energy relation | 6,632 | 4.0% | ||
| 13 | IT relation | 2,001 | 1.2% | ||
| 14 | Medical institution | 595 | 0.4% | ||
| 15 | Office general | 2,736 | 1.7% | ||
| 16 | Pundit | 502 | 0.3% | 12,295 | 7.4% |
| 17 | Consulting | 3,567 | 2.2% | ||
| 18 | Research laboratories & intelligence agency | 3,966 | 2.4% | ||
| 19 | Civilian | 3,006 | 1.8% | ||
| 20 | Student etc. | 1,254 | 0.8% | ||
| 21 | The Diet & local authority representative | 248 | 0.1% | 11,318 | 6.8% |
| 22 | Central government office | 994 | 0.6% | ||
| 23 | Local public entity | 5,305 | 3.2% | ||
| 24 | Other related group | 4,771 | 2.9% | ||
| 25 | Overseas visitor | 3,602 | 2.2% | 3,602 | 2.2% |
| 26 | Press | 227 | 0.1% | 227 | 0.1% |
| TOTAL | 165,810 | 100.0% | 165,810 | 100.0% | |
Number of exhibitor & booth by area
N-EXPO 2013
| Area | Exhibitor | Booth |
| Waste disposal / resource recovery | 185 | 1,104 |
| 3R, waste business corner | 14 | 30 |
| Demolitiopn, construction, recycling | 5 | 11 |
| Water, soil, air improvement | 145 | 212 |
| Green plaza & eco-packaging | 21 | 50 |
| Corner for earthquake disaster correspondence | 15 | 22 |
| Affiliate, academic institution & Eco-products | 14 | 27 |
| Biomas | 30 | 53 |
| IT solution, analysis, measurement | 15 | 25 |
| Collection & transport | 15 | 159 |
| Thermal | 14 | 70 |
| Venture corner | 11 | 20 |
| N-EXPO sub-total | 484 | 1,783 |
| GWPE (Global Warming Preservation Exhibition) | 113 | 269 |
| GWPE venture corner | 8 | 11 |
| GWPE sub-total | 121 | 280 |
| Grand-total | 605 | 2,063 |